System dashboard
By connecting to the web interface of a Netcraze router, you will see the starting page System dashboard.
It contains the main information panels (their set depends on the capabilities of the model and a selection of components of the device's built-in operating system) — Internet, Local Network, Network ports, Mesh Wi-Fi System, Traffic Monitor, Wi-Fi Monitor, About the system.
Internet
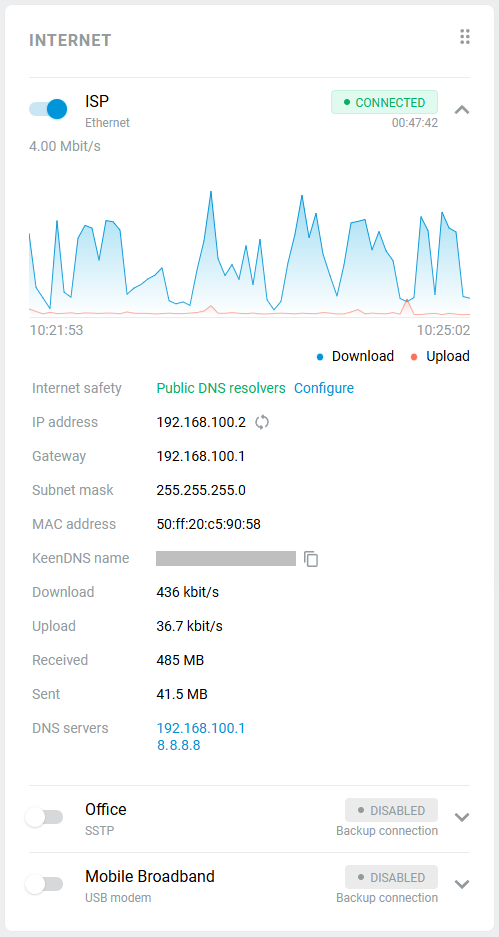
On this panel, you can view the Internet connection status, connection session duration, current speeds of traffic reception/transmission, WAN IP address on the external interface of the device, registered CrazeDNS domain name, and total amount of received and sent data.
Important
The graph shows the current receiving and transmitting speeds for the last 3 minutes. This is not the maximum throughput rate of your internet channel.
If a backup connection is configured, you will also see the status and information about this connection.
Local Network
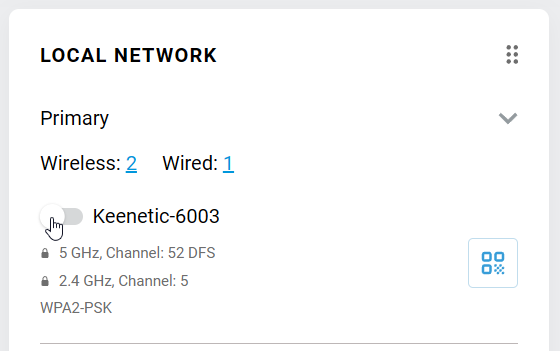
This section provides information about the router's network segments. Here you can see the number of clients connected to the router via cable and Wi-Fi.
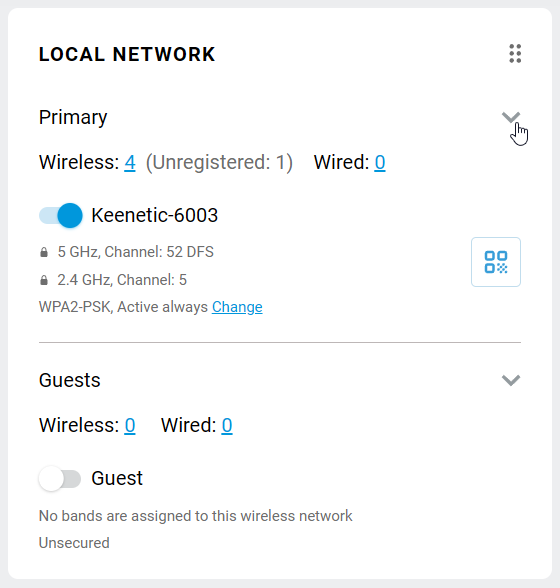
Click the  icon to display more information about network segments. For example, you can view the set IP address of the network and find out the current Wi-Fi channel width and power.
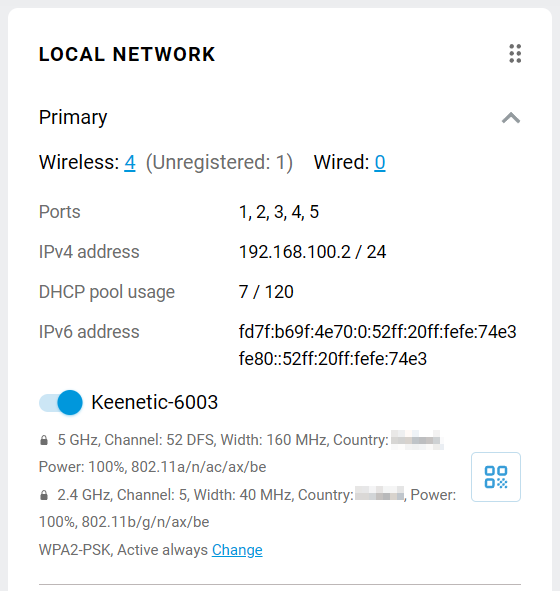
You can quickly turn on/off the Wi-Fi network using the switch.
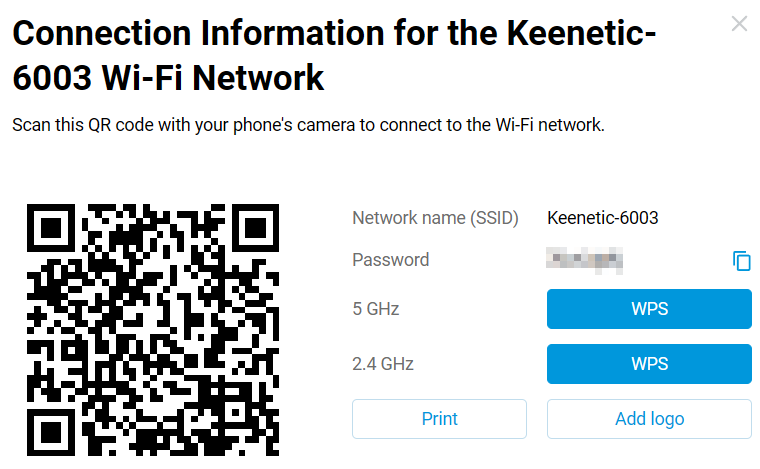
Clicking on the  icon will show information about this Wi-Fi network, including the password and QR code that will allow you to connect. You will be able to copy the password, print out the information and run WPS. For example:
Network ports
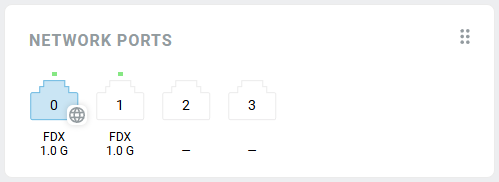
Here you can see the port status of the built-in network switch, the cable connection, and the duplex mode. If a port is configured in a certain way (for connecting to Provider, IPTV set-top box, Telephony), a special icon will be displayed on this port. By clicking on the name of the panel, you will be redirected to the General System Settings page.
Wi-Fi Monitor
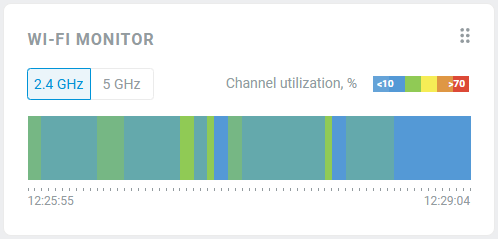
This section shows the load graph of the radio channel in use. The graph shows the channel utilization for the last 3 minutes. By clicking on the section title, you will be redirected to the Wi-Fi Monitor page for more information.
Traffic Monitor
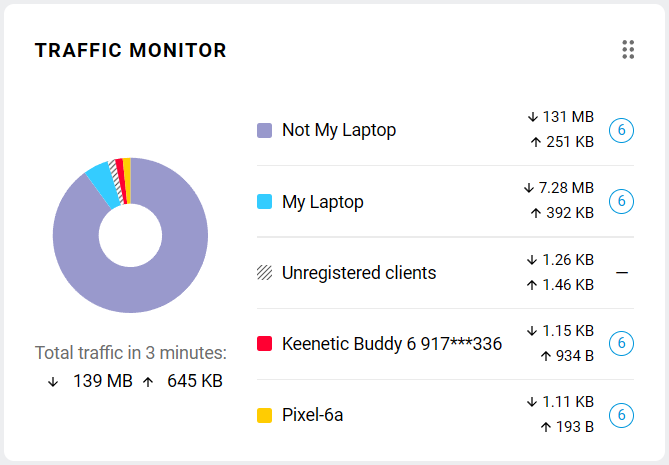
This section shows a chart of the Top 5 traffic consumers in the last 3 minutes. By clicking on the section title, you will be redirected to the Traffic Monitor page for more information.
About the system
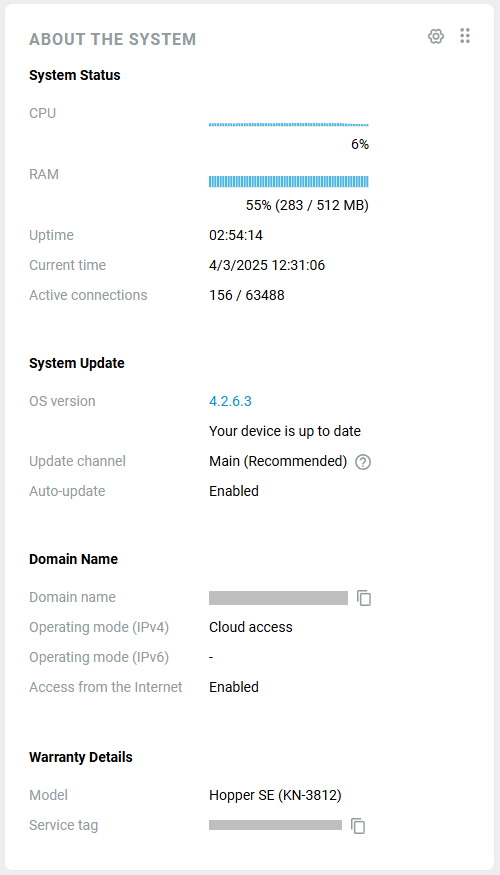
This panel shows information about the router's model, its service tag, the NDMS version, auto-update status, device operating time, current time (synchronized with a time server automatically when connected to the Internet), CPU load, and available and occupied memory (RAM).