Site Details Page
To get to the Site Detail Page (Детальная страница объекта), click on the Site name on the Sites (Название объекта) page or the Details (Подробнее) option in the context menu.
On the Site Detail Page you can get information about various important parameters, such as:
the status and speed of Internet connections,
the parameters of the CPU and RAM load of the controller,
the number of the connected clients,
the detailed information on each connection,
the graphs of traffic consumption by the clients and connection types,
the distribution of the connected clients by the segments.
You can also "seamlessly" (with a single click) navigate to the web interface of the site's controller. Here you can find out how to set up access from the Internet to the web interface.
Site Detail Page consists of tabs:
Dashboard (Обзорная панель)
Nodes (Узлы)
Clients (Клиенты)
Operations (Операции)
Notifications (Уведомления)
Information (Сведения)
Dashboard (Обзорная панель)
Dashboard (Обзорная панель) — displays important and up-to-date information for monitoring the status of the site. The information is available in different views.
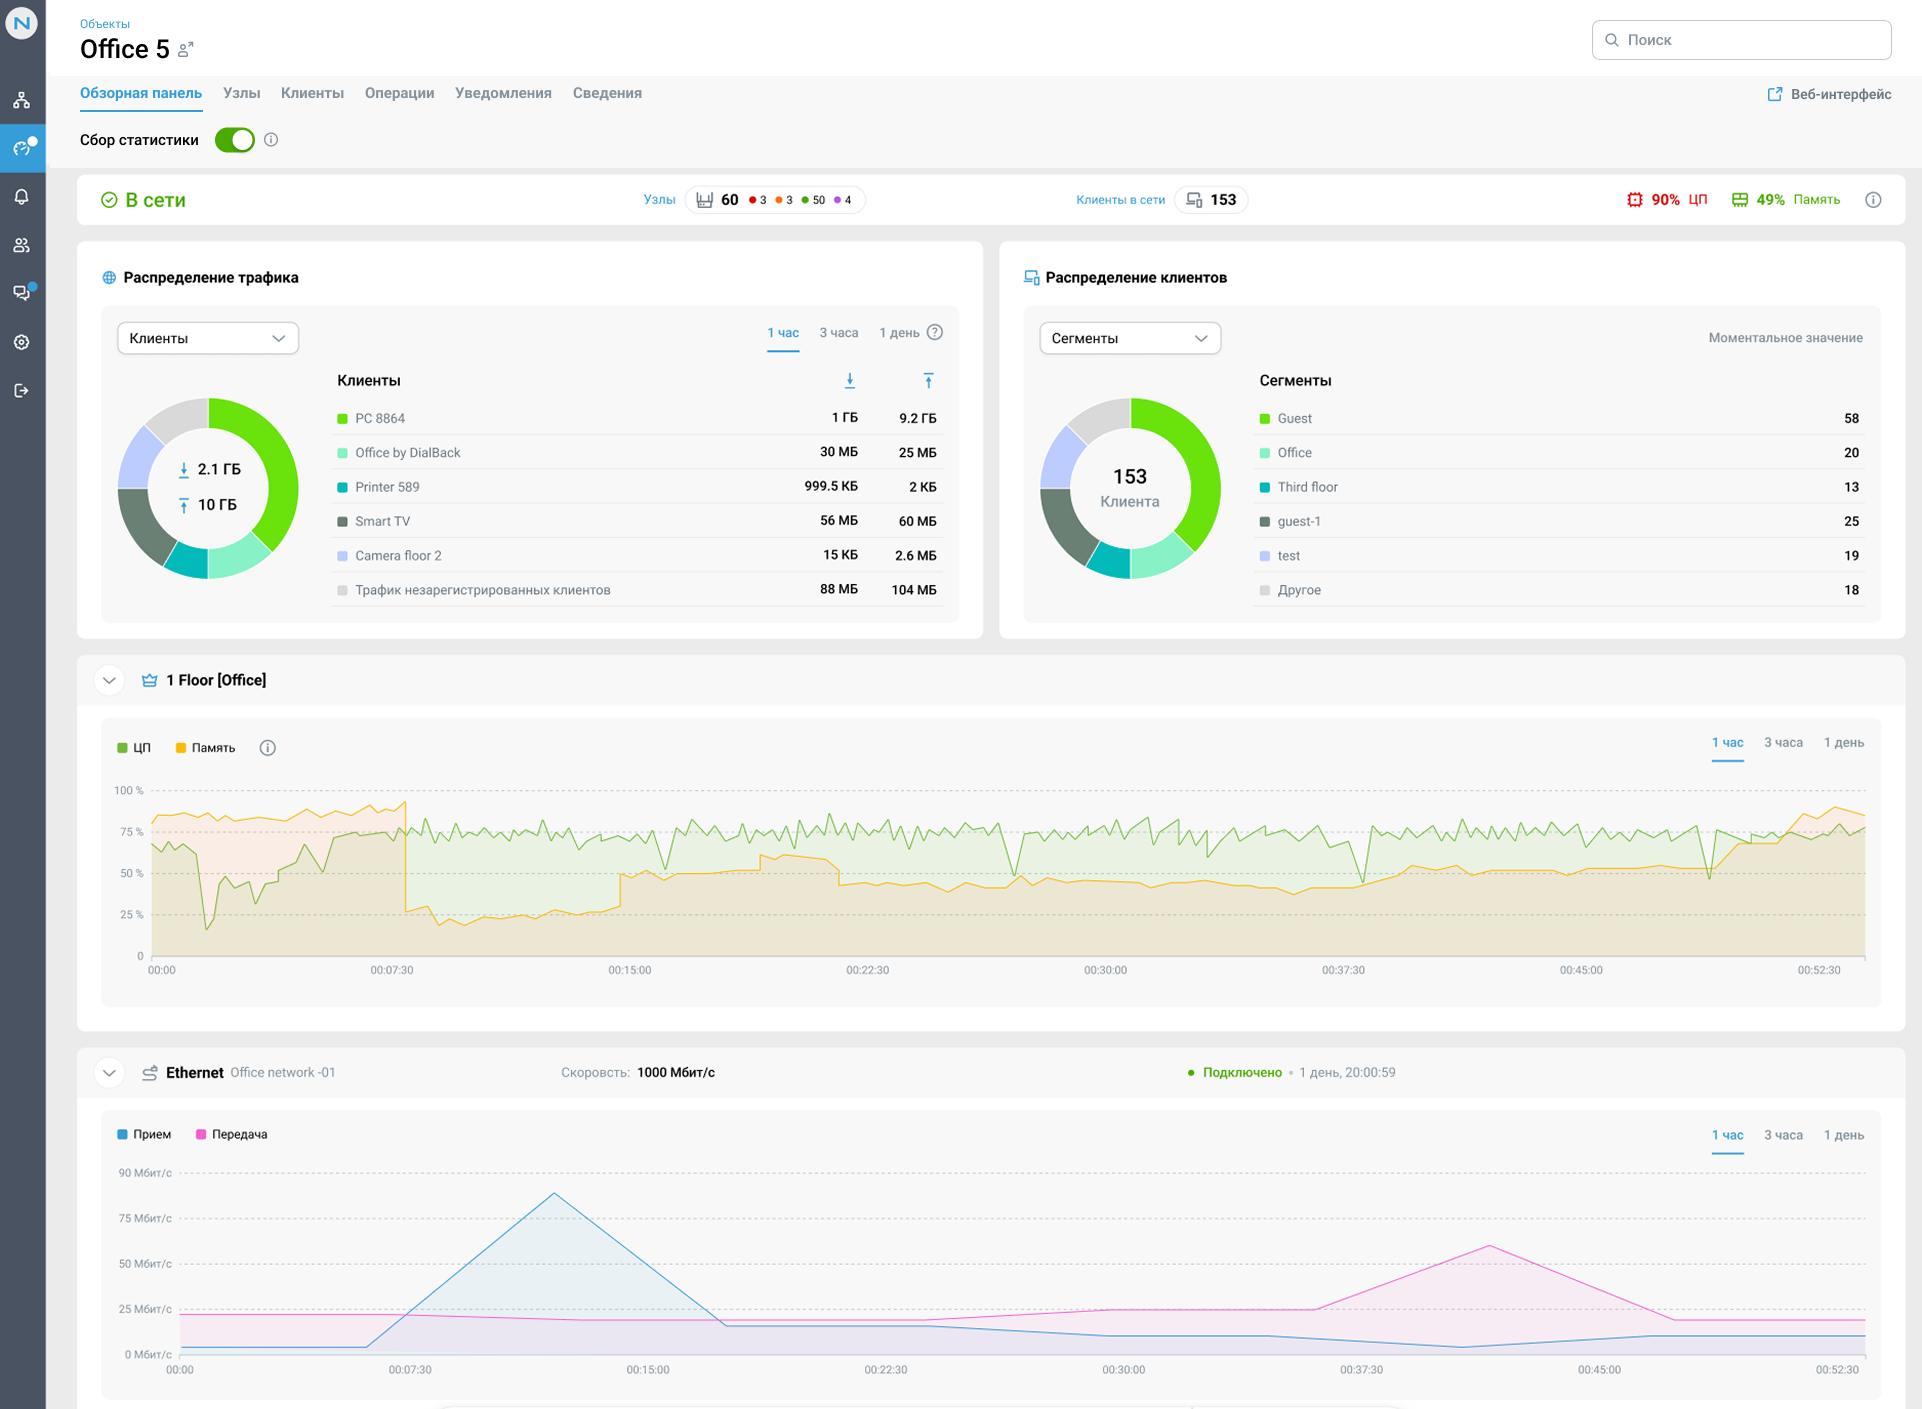
At the top of the site details page there is a statistics collection toggle, enabled by default. Only users with the Owner or Administrator role can use it. When the toggle is turned off, the collection of two types of data stops:
Data for the charts on the site page
Traffic distribution
CPU/Memory
Connections
For client devices (Clients section), the following stop being updated:
Signal / Protocols —
ht,linkSpeed,rssi,standards,securityConnection —
wifiBand,wiredPort,isWiredReceived —
txBytesTransmitted —
rxBytes
For extenders (Nodes section):
Signal / Protocols —
ht,linkSpeed,rssi,txssConnection —
wifiBand,isWiredCPU
RAM
All other polling of the controller and retrieval of service data continue unchanged.
When the toggle is switched back on, data collection resumes, but no data is available on the charts for the period when it was disabled.
The next panel consists of the site status, the number of connected nodes and clients online, as well as CPU and RAM parameters of the controller, which are instantaneous current values. You can read more about site statuses and errors here.
Traffic distribution (Распределение трафика) chart for the last
1 hour,3 hours, and1 dayis available in 2 views:Clients (Клиенты) — traffic distribution for registered clients only. Unregistered clients are displayed as Unregistered clients traffic (Трафик незарегистрированных клиентов). If you want to register a client, you can do it via the Netcraze web interface.
Connection type (Тип подключения) — traffic distribution for wireless and wired connections.
Important
If the reboot coincides with the controller's unavailability, the data in the interface is displayed from the moment the controller becomes available.
Client distribution (Распределение клиентов) chart in real-time is available in 2 views:
Segments (Сегменты) — distribution of the online clients by the network segment. By default, the Home segment is activated on all Netcraze devices. If you want to create more segments, you can do it in the Netcraze web interface.
Connection type (Тип подключения) — distribution of the registered online clients over wireless and wired connections.
CPU/RAM values (ЦП/Память) are plotted based on the last
1 hour,3 hours, and1 dayof data for the site's controller. The graph shows the maximum values for a given time period.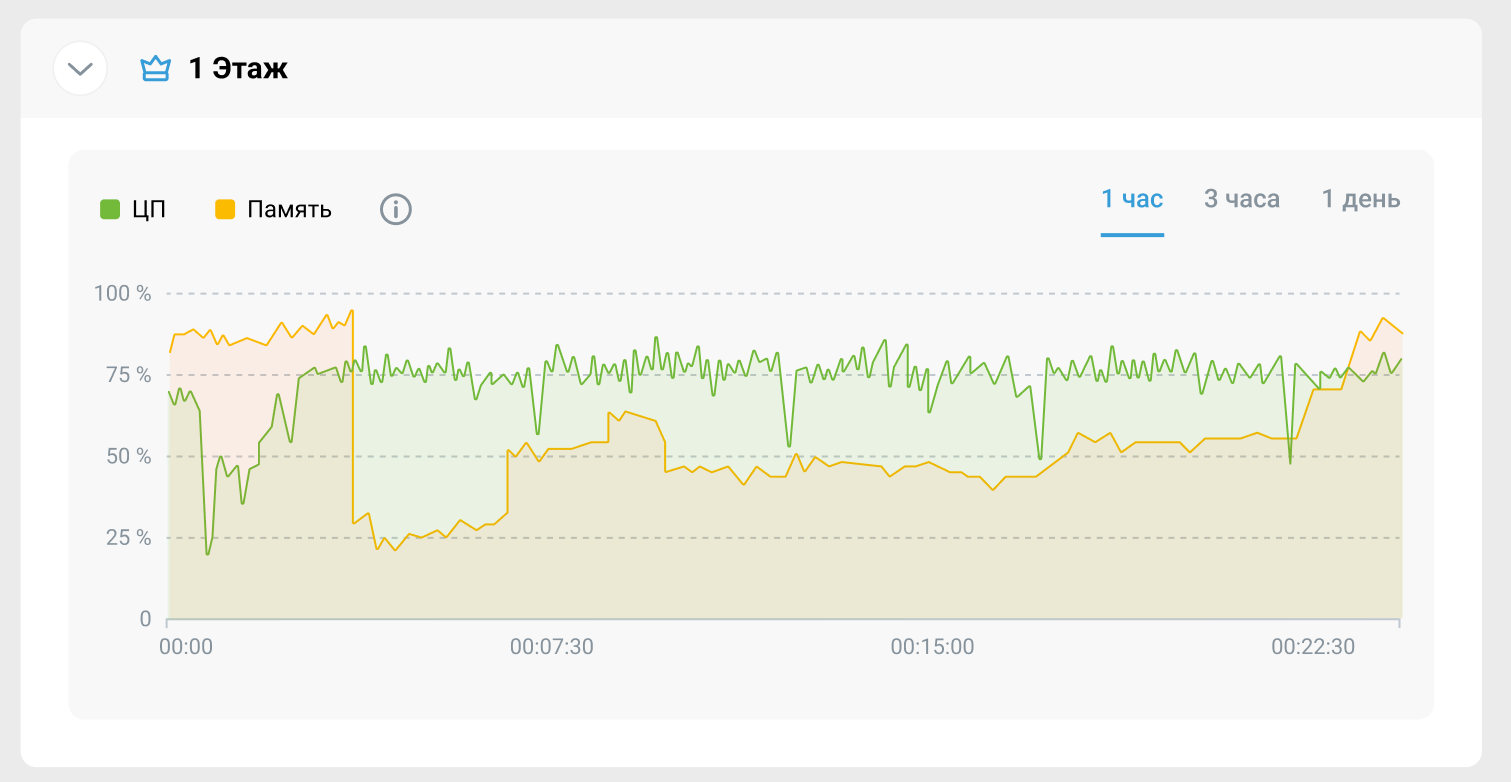
Connections block shows all your controller's available connections and connection parameters. If your controller has more than 1 connection (for example, a backup channel via a 4G modem), this connection is also displayed in this block. The speed graph for a connected Internet connection is based on the last
1 hour,3 hours, and1 day. You can read more about how to connect to the Internet here.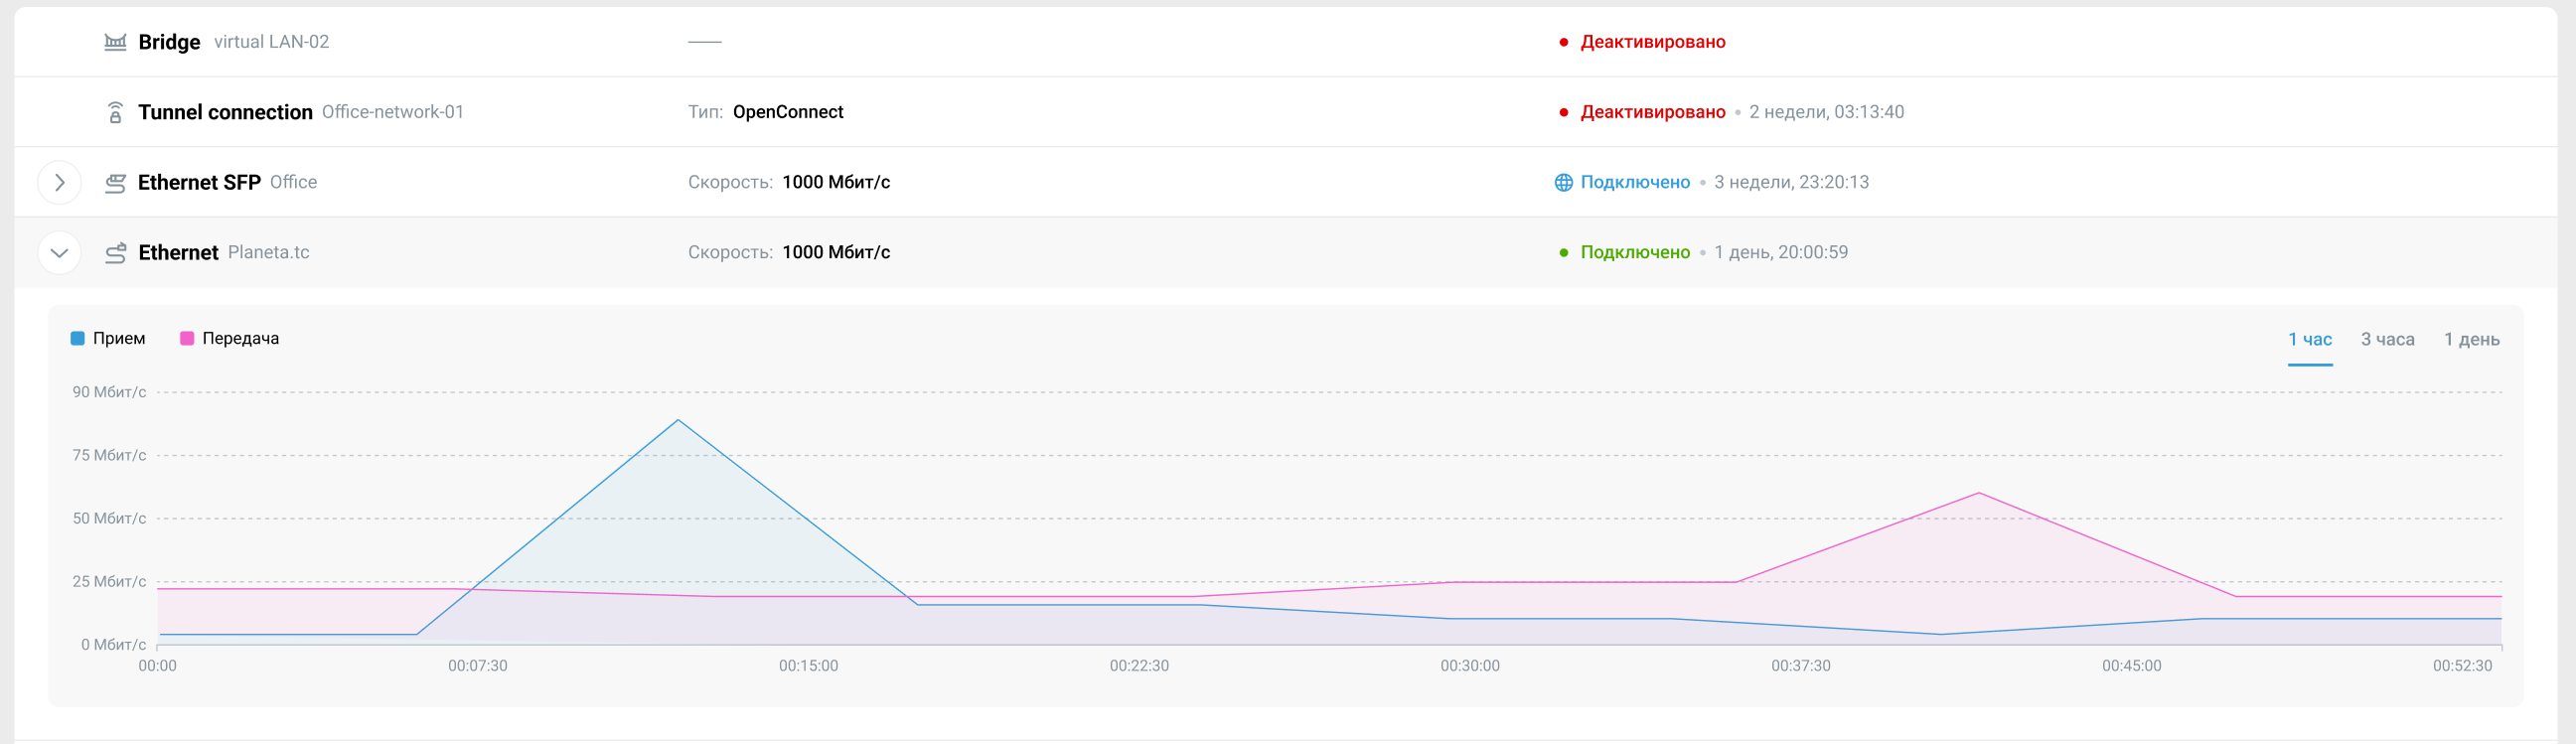
Nodes (Узлы)
In the Nodes (Узлы) tab, you can see all Netcraze devices included in your site — their statuses, models, clients connected to each node, and technical parameters. You can also customize the display of columns and sort and filter the data in the Nodes table.
Clients (Клиенты)
In the Clients (Клиенты) tab, you can see all registered and unregistered client devices connected to your site and their technical parameters. You can also customize the display of columns and sort and filter the data in the Clients table.
Operations (Операции)
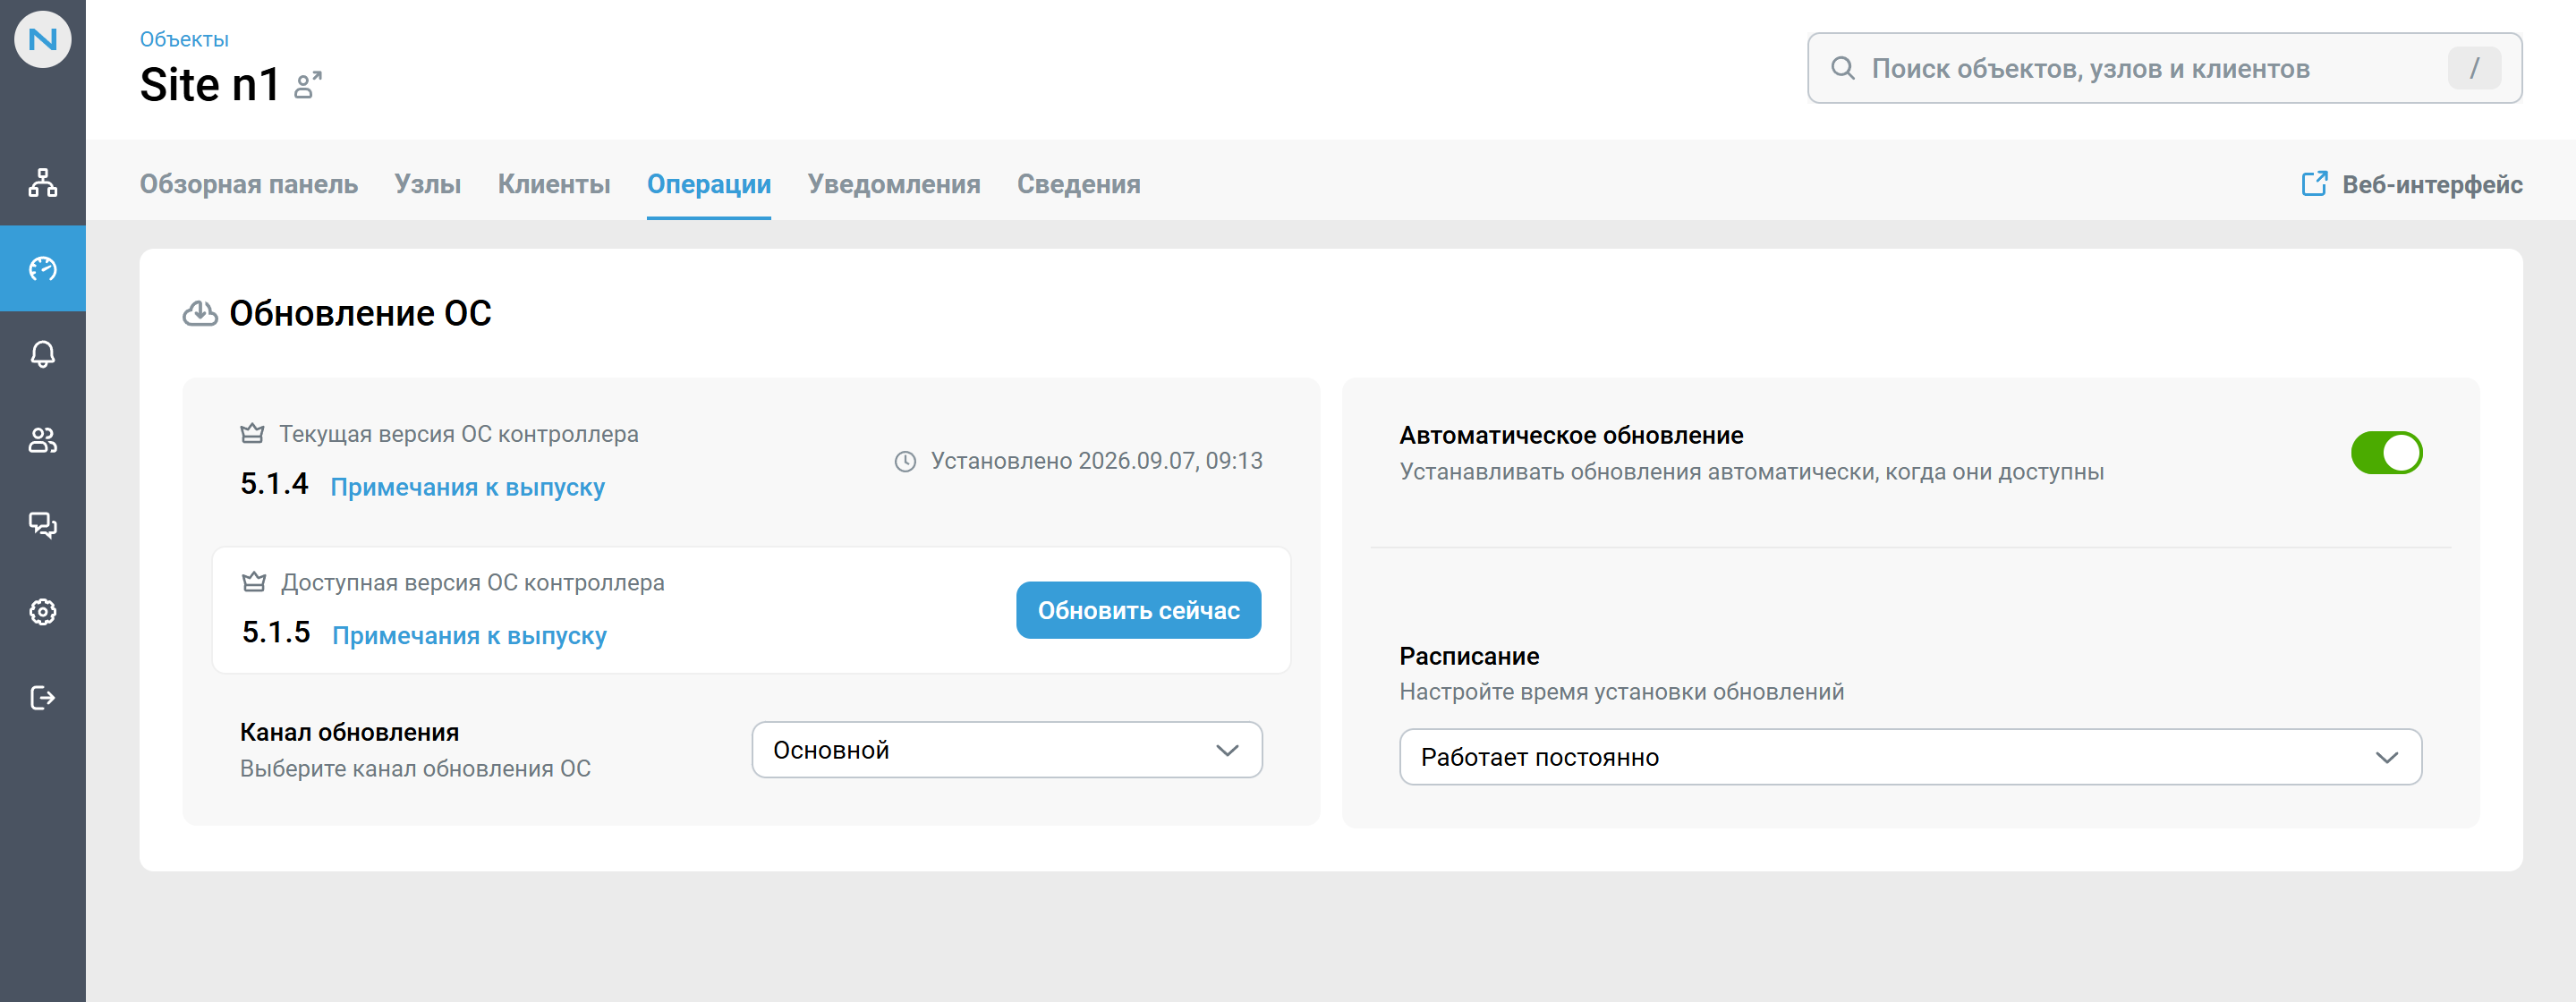
The Operations (Операции) tab shows the current OS version installed on the site's controller and lets you manage its update. Here you can:
check whether a new OS version is available and review its changes in the release notes;
start an update manually with a single click of the Update now (Обновить сейчас) button (not available to the Viewer role);
enable/disable automatic updates and configure the schedule for their installation (not available to the Viewer role);
select the update channel (not available to the Manager and Viewer roles).
Note
Note: Some actions on this tab are restricted based on your role. See the Teams article for details
Notifications (Уведомления)
On the Notifications (Уведомления) tab, you can configure notifications for this site. These settings apply only to the current site. For information on configuring group notifications for all sites, nodes and clients, see the article Telegram notifications
Information (Сведения)
The Information (Сведения) tab stores details for quick communication with the contact responsible for the site.
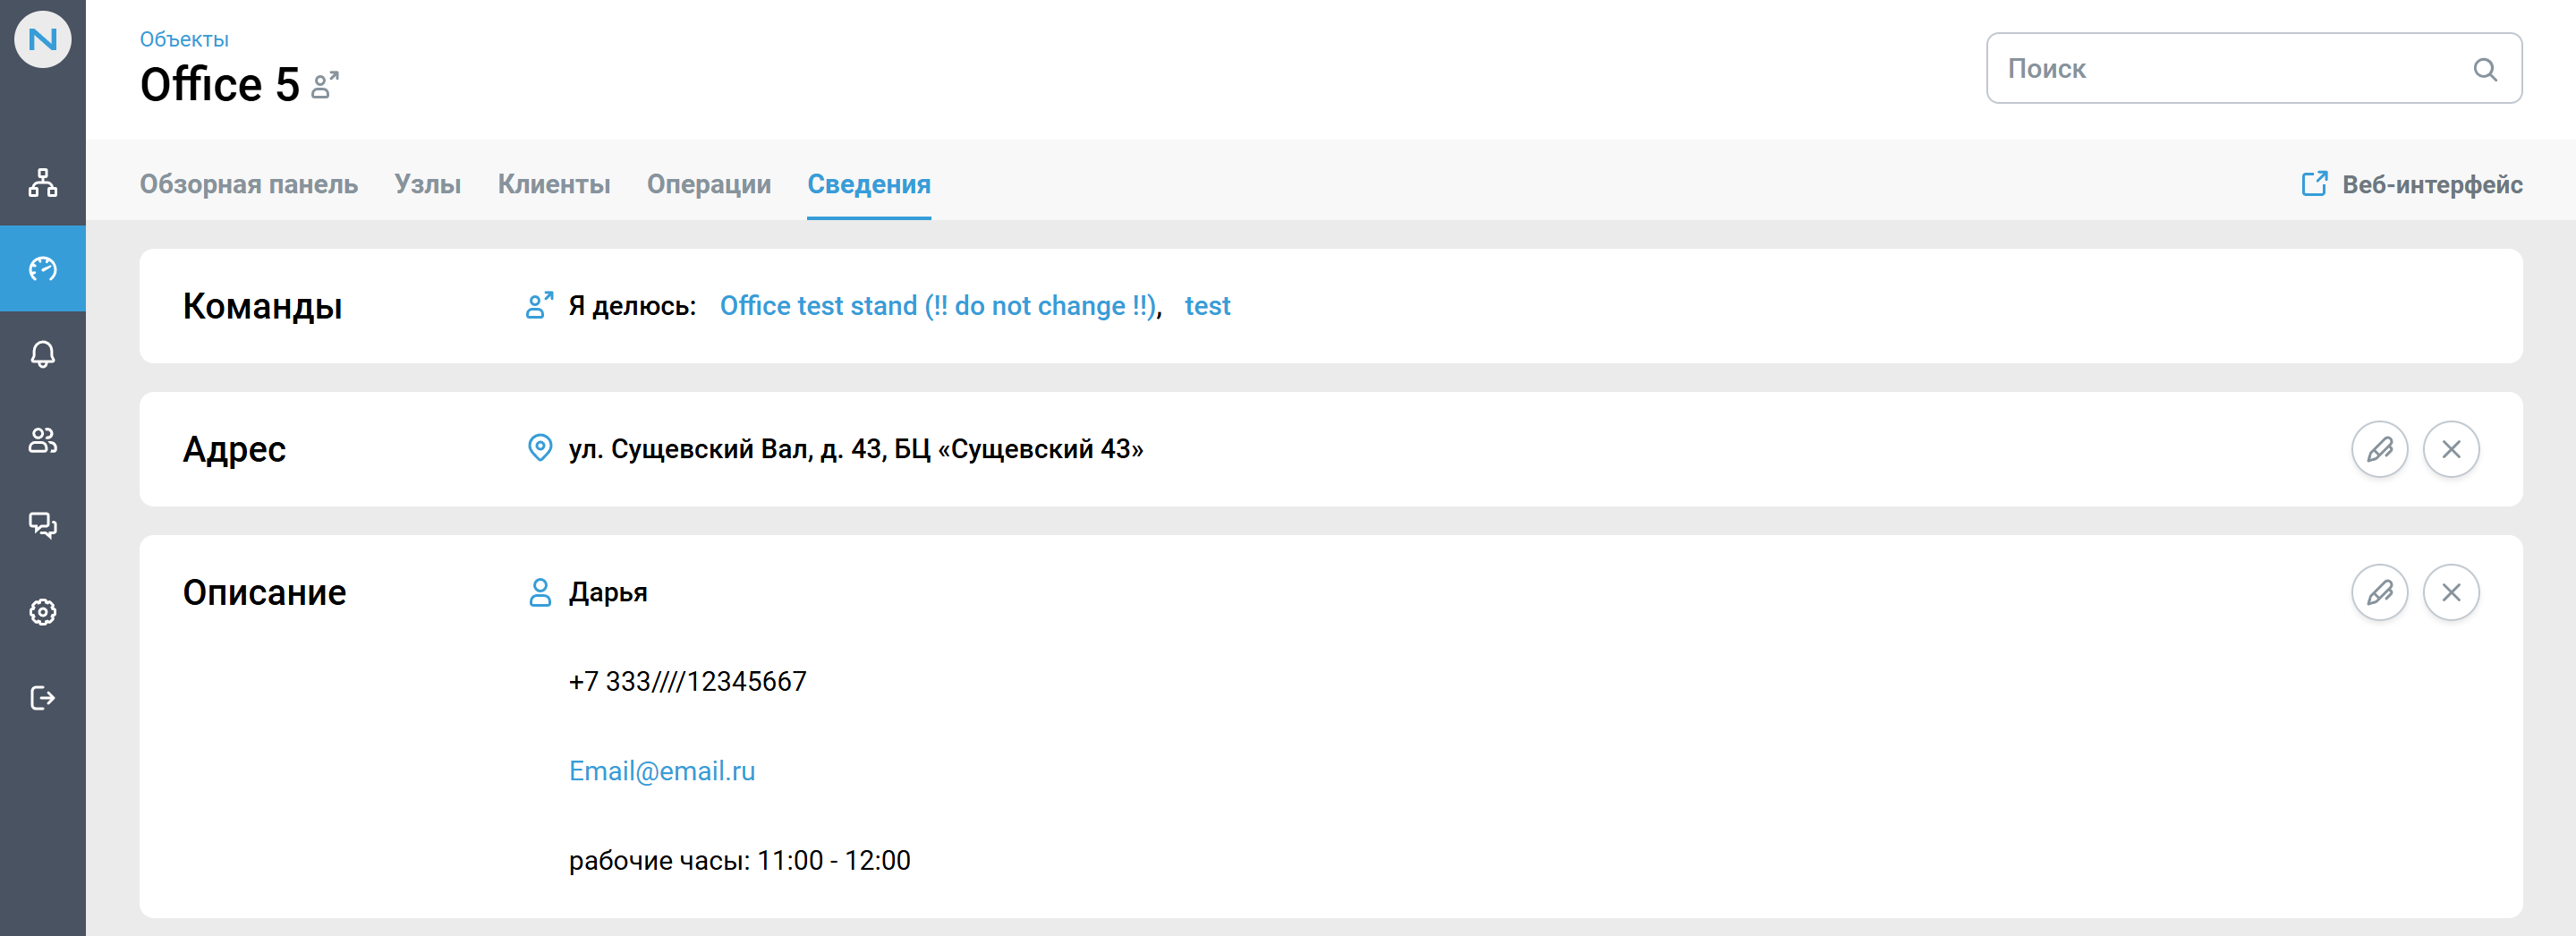
The Teams (Команды) information block displays the teams that have been granted access to the site. Next are blocks that can be filled in with additional information:
Address (Адрес) — for example, the actual address of the controller location.
Description (Описание) — here, you can add any useful information for communication, such as name, phone number, e-mail, and necessary comments to this contact.
Only users with the Owner or Administrator roles can edit information about a site on the Information tab.